Vue3 + Rough.js 教学 实现手绘风柱状图

 0
0 0
0 0
0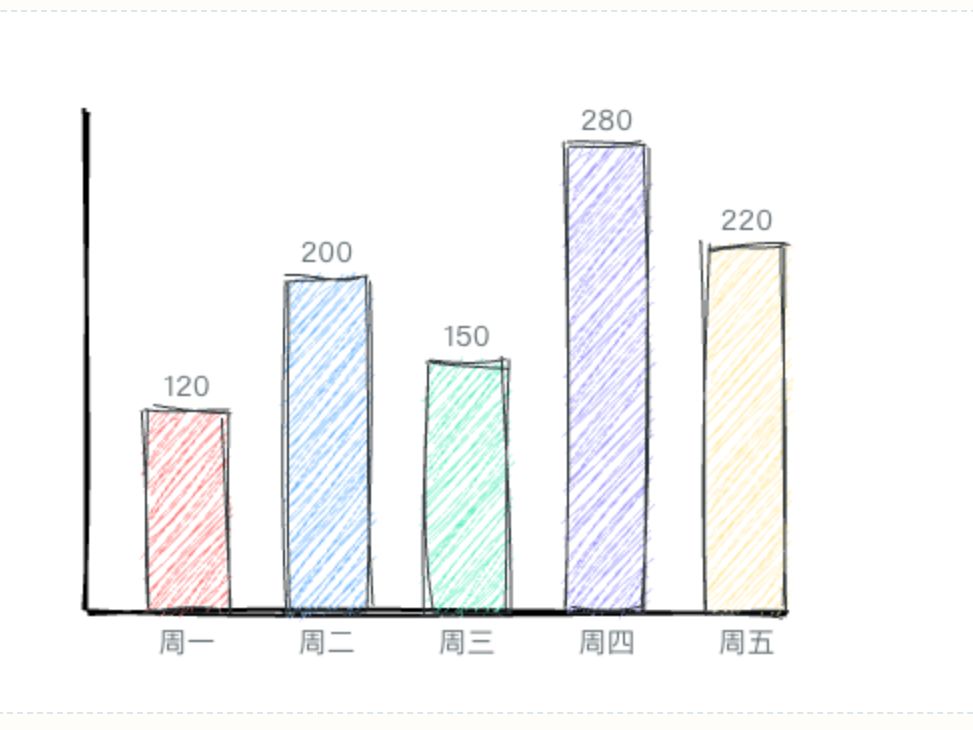
本教程基于 Vue 3 语法,详细介绍了如何引入并使用手绘风绘图库 Rough.js。文章从最基础的库安装、Canvas 画布绑定,逐步延伸至矩形、圆形及多样化填充样式(斜线、交叉网格等)的绘制方法。最后通过一个完整的“手绘柱状图”实战案例,演示了如何将数据与手绘线条相结合,非常适合想要打造个性化 UI 或极简草稿风图表的开发者学习。
1
安装

在终端运行以下命令:
# 安装 roughjs 核心库
npm install roughjs
2
模版绑定
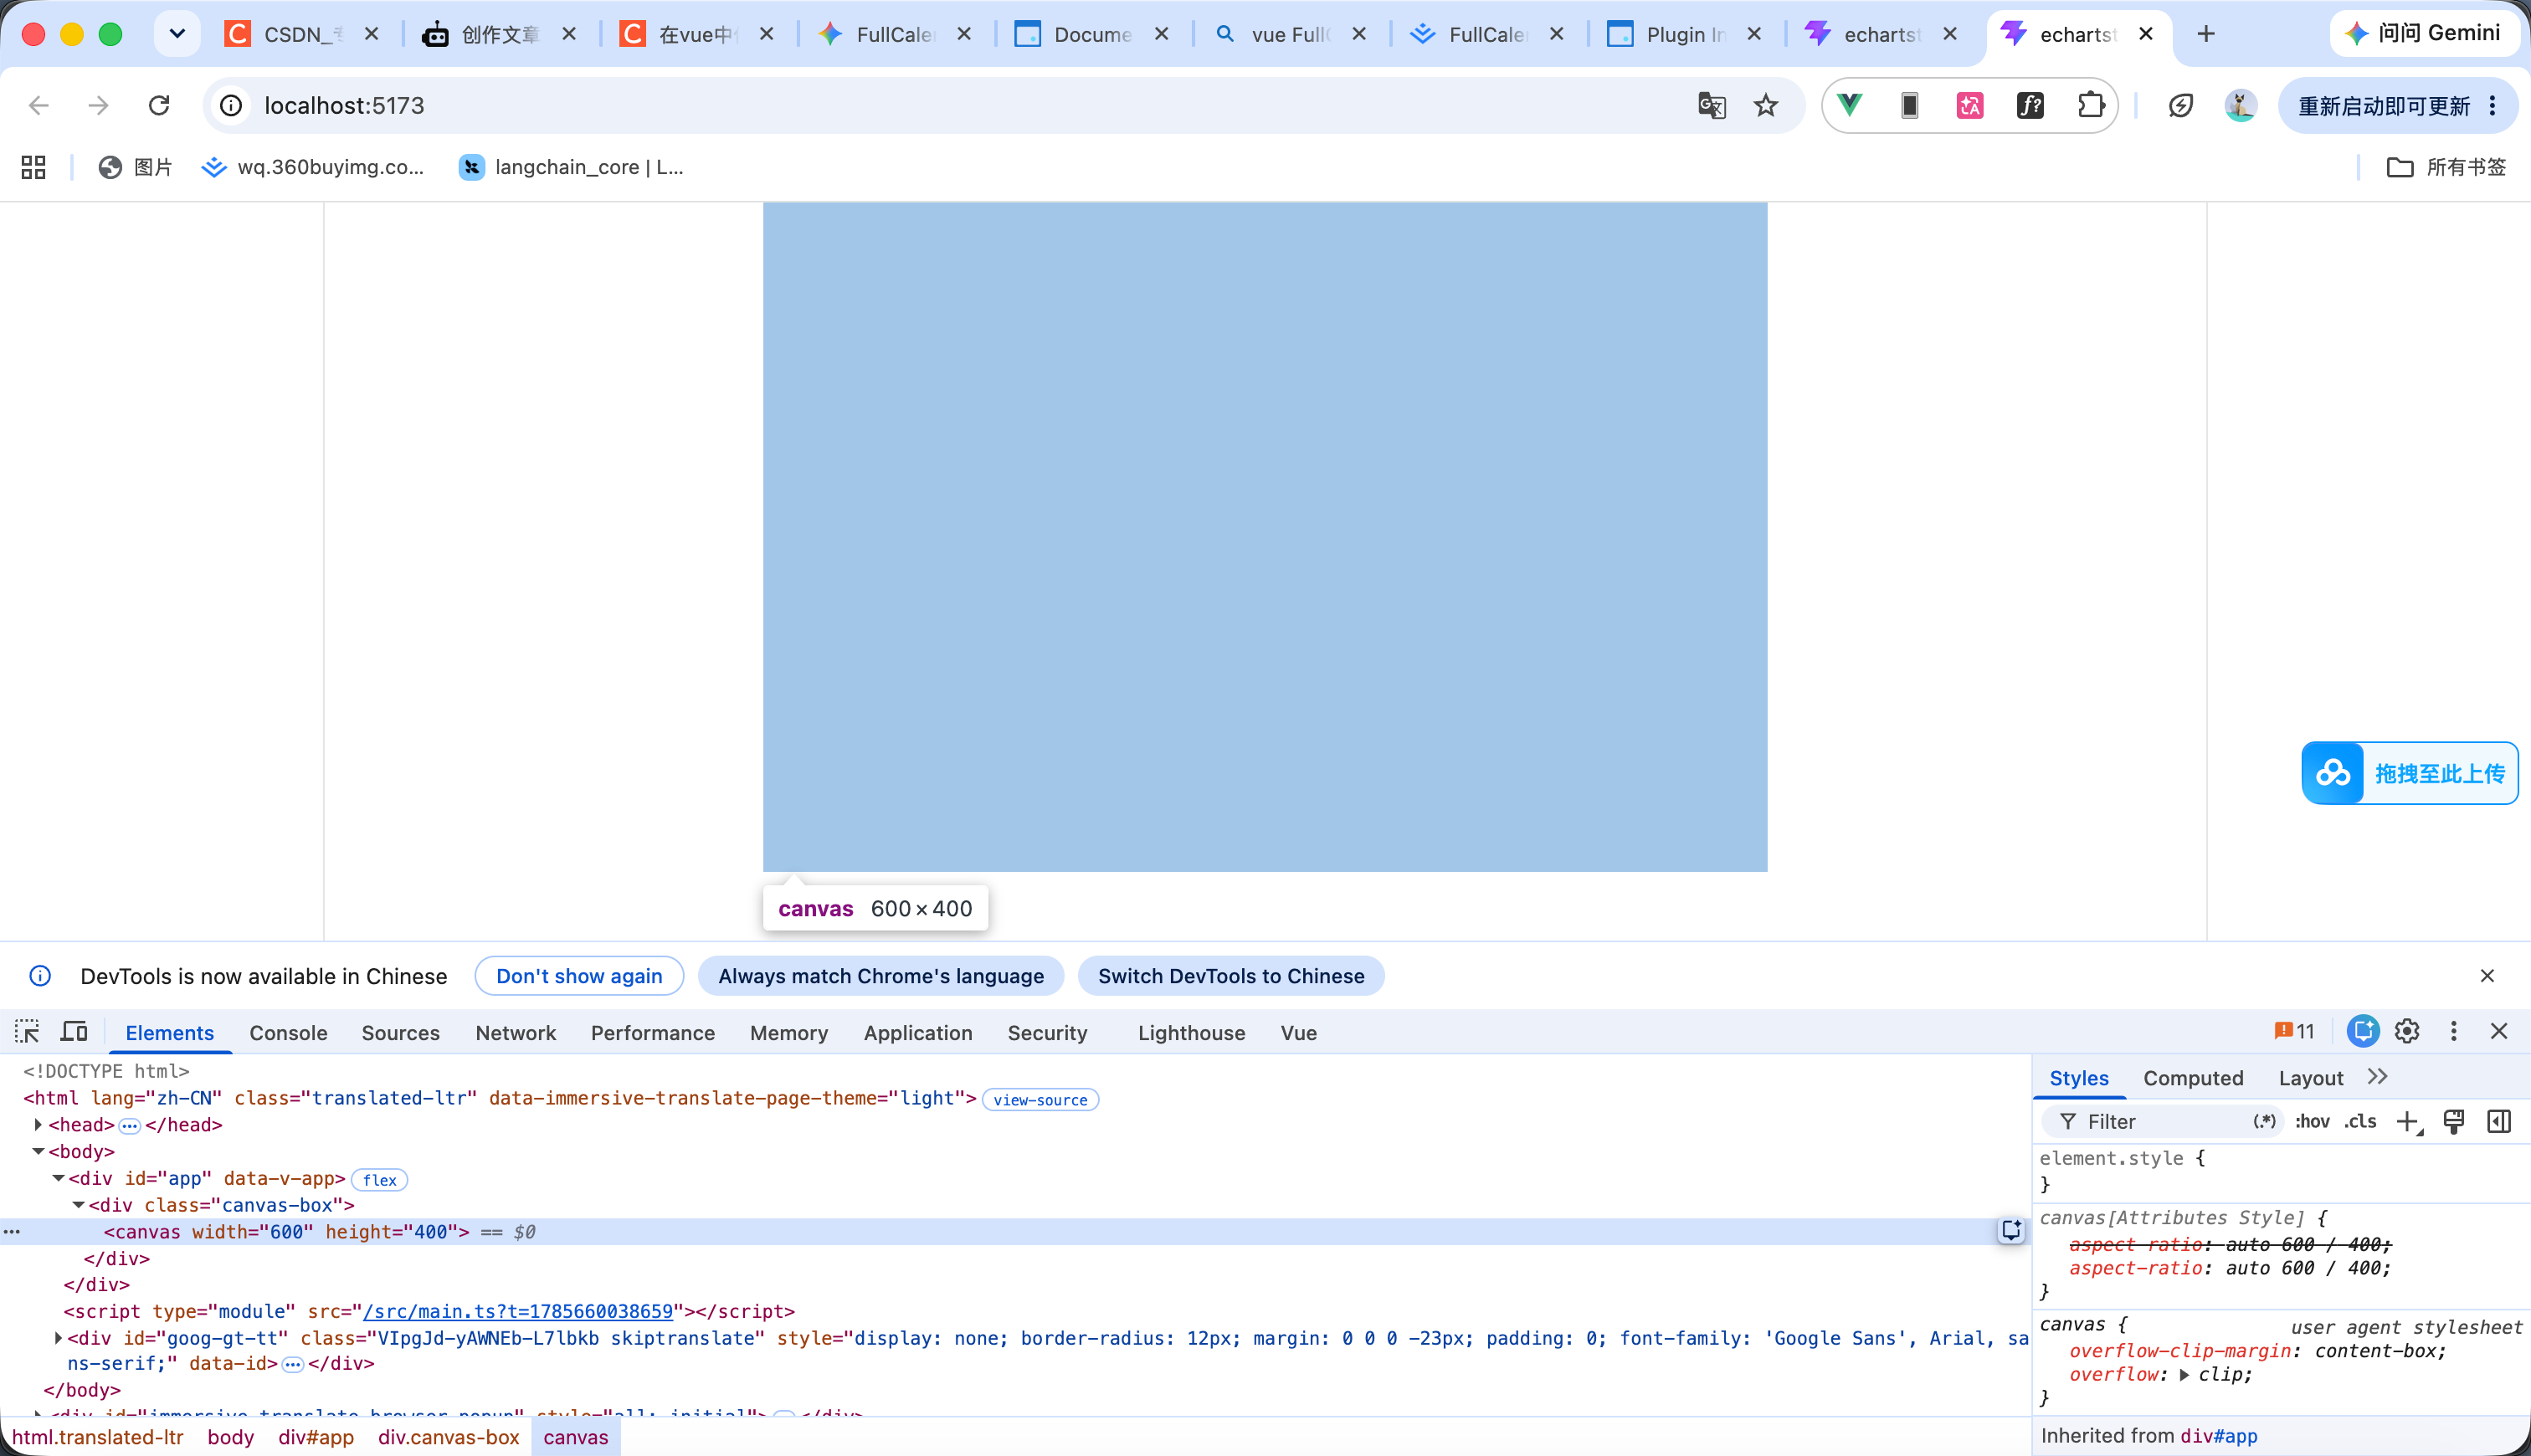
首先我们创建一个 canvas 进行节点的绑定
<script setup lang="ts">
import { ref, onMounted } from 'vue'
import rough from 'roughjs'
// 绑定 HTML Canvas 节点
const canvasRef = ref<HTMLCanvasElement | null>(null)
onMounted(() => {
if (!canvasRef.value) return
// 1. 初始化 Rough.js Canvas 画板
const rc = rough.canvas(canvasRef.value)
console.log('Rough 画板初始化完成:', rc)
})
</script>
<template>
<div class="canvas-box">
<canvas ref="canvasRef" width="600" height="400"></canvas>
</div>
</template>
3
基础手绘几何图形绘制
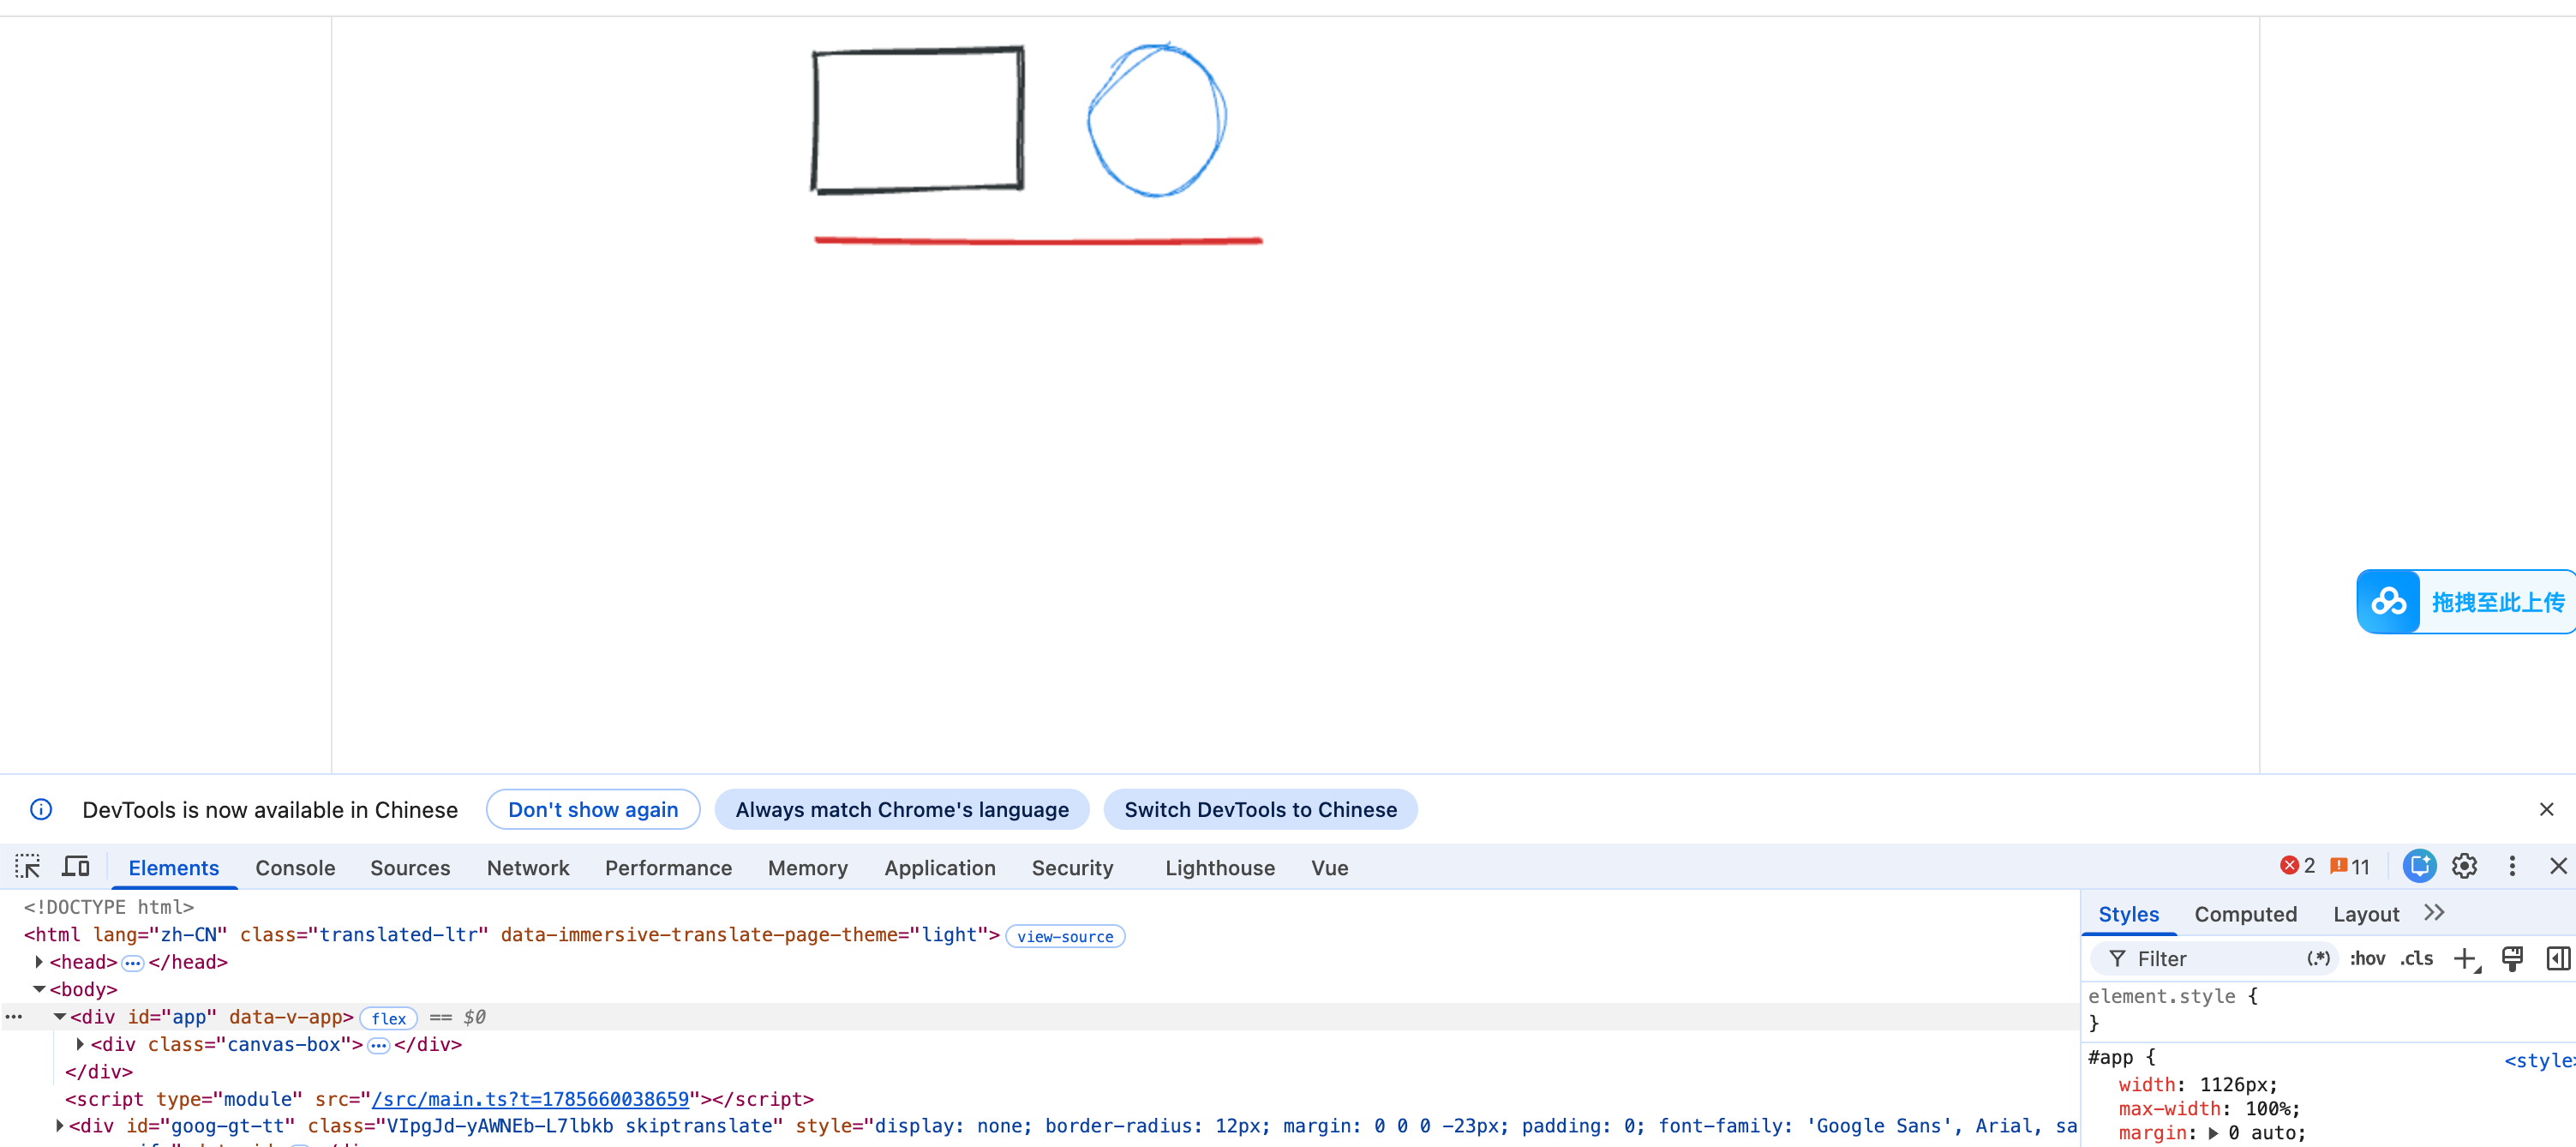
这个代码的核心就是通过 rc.rectangle(矩形)、rc.circle(圆形)、rc.line(线条)等基础绘图方法,传入不同的样式参数
<script setup lang="ts">
import { ref, onMounted } from 'vue'
import rough from 'roughjs'
// 绑定 HTML Canvas 节点
const canvasRef = ref<HTMLCanvasElement | null>(null)
// 在 onMounted 中增加绘制逻辑
onMounted(() => {
if (!canvasRef.value) return
const rc = rough.canvas(canvasRef.value)
// 手绘矩形:x, y, width, height, options
rc.rectangle(20, 20, 120, 80, {
// 边框颜色
stroke: '#2d3436',
// 边框粗细
strokeWidth: 2,
// 手绘抖动程度(默认 1,数值越大越像草稿)
roughness: 1.5
})
// 手绘圆:x, y, diameter, options
rc.circle(220, 60, 80, {
stroke: '#0984e3',
// 提高粗糙度,产生强烈的草稿线条感
roughness: 2.5
})
// 手绘连线:x1, y1, x2, y2, options
rc.line(20, 130, 280, 130, {
stroke: '#d63031',
strokeWidth: 3
})
})
</script>
<template>
<div class="canvas-box">
<canvas ref="canvasRef" width="600" height="400"></canvas>
</div>
</template>
4
填充
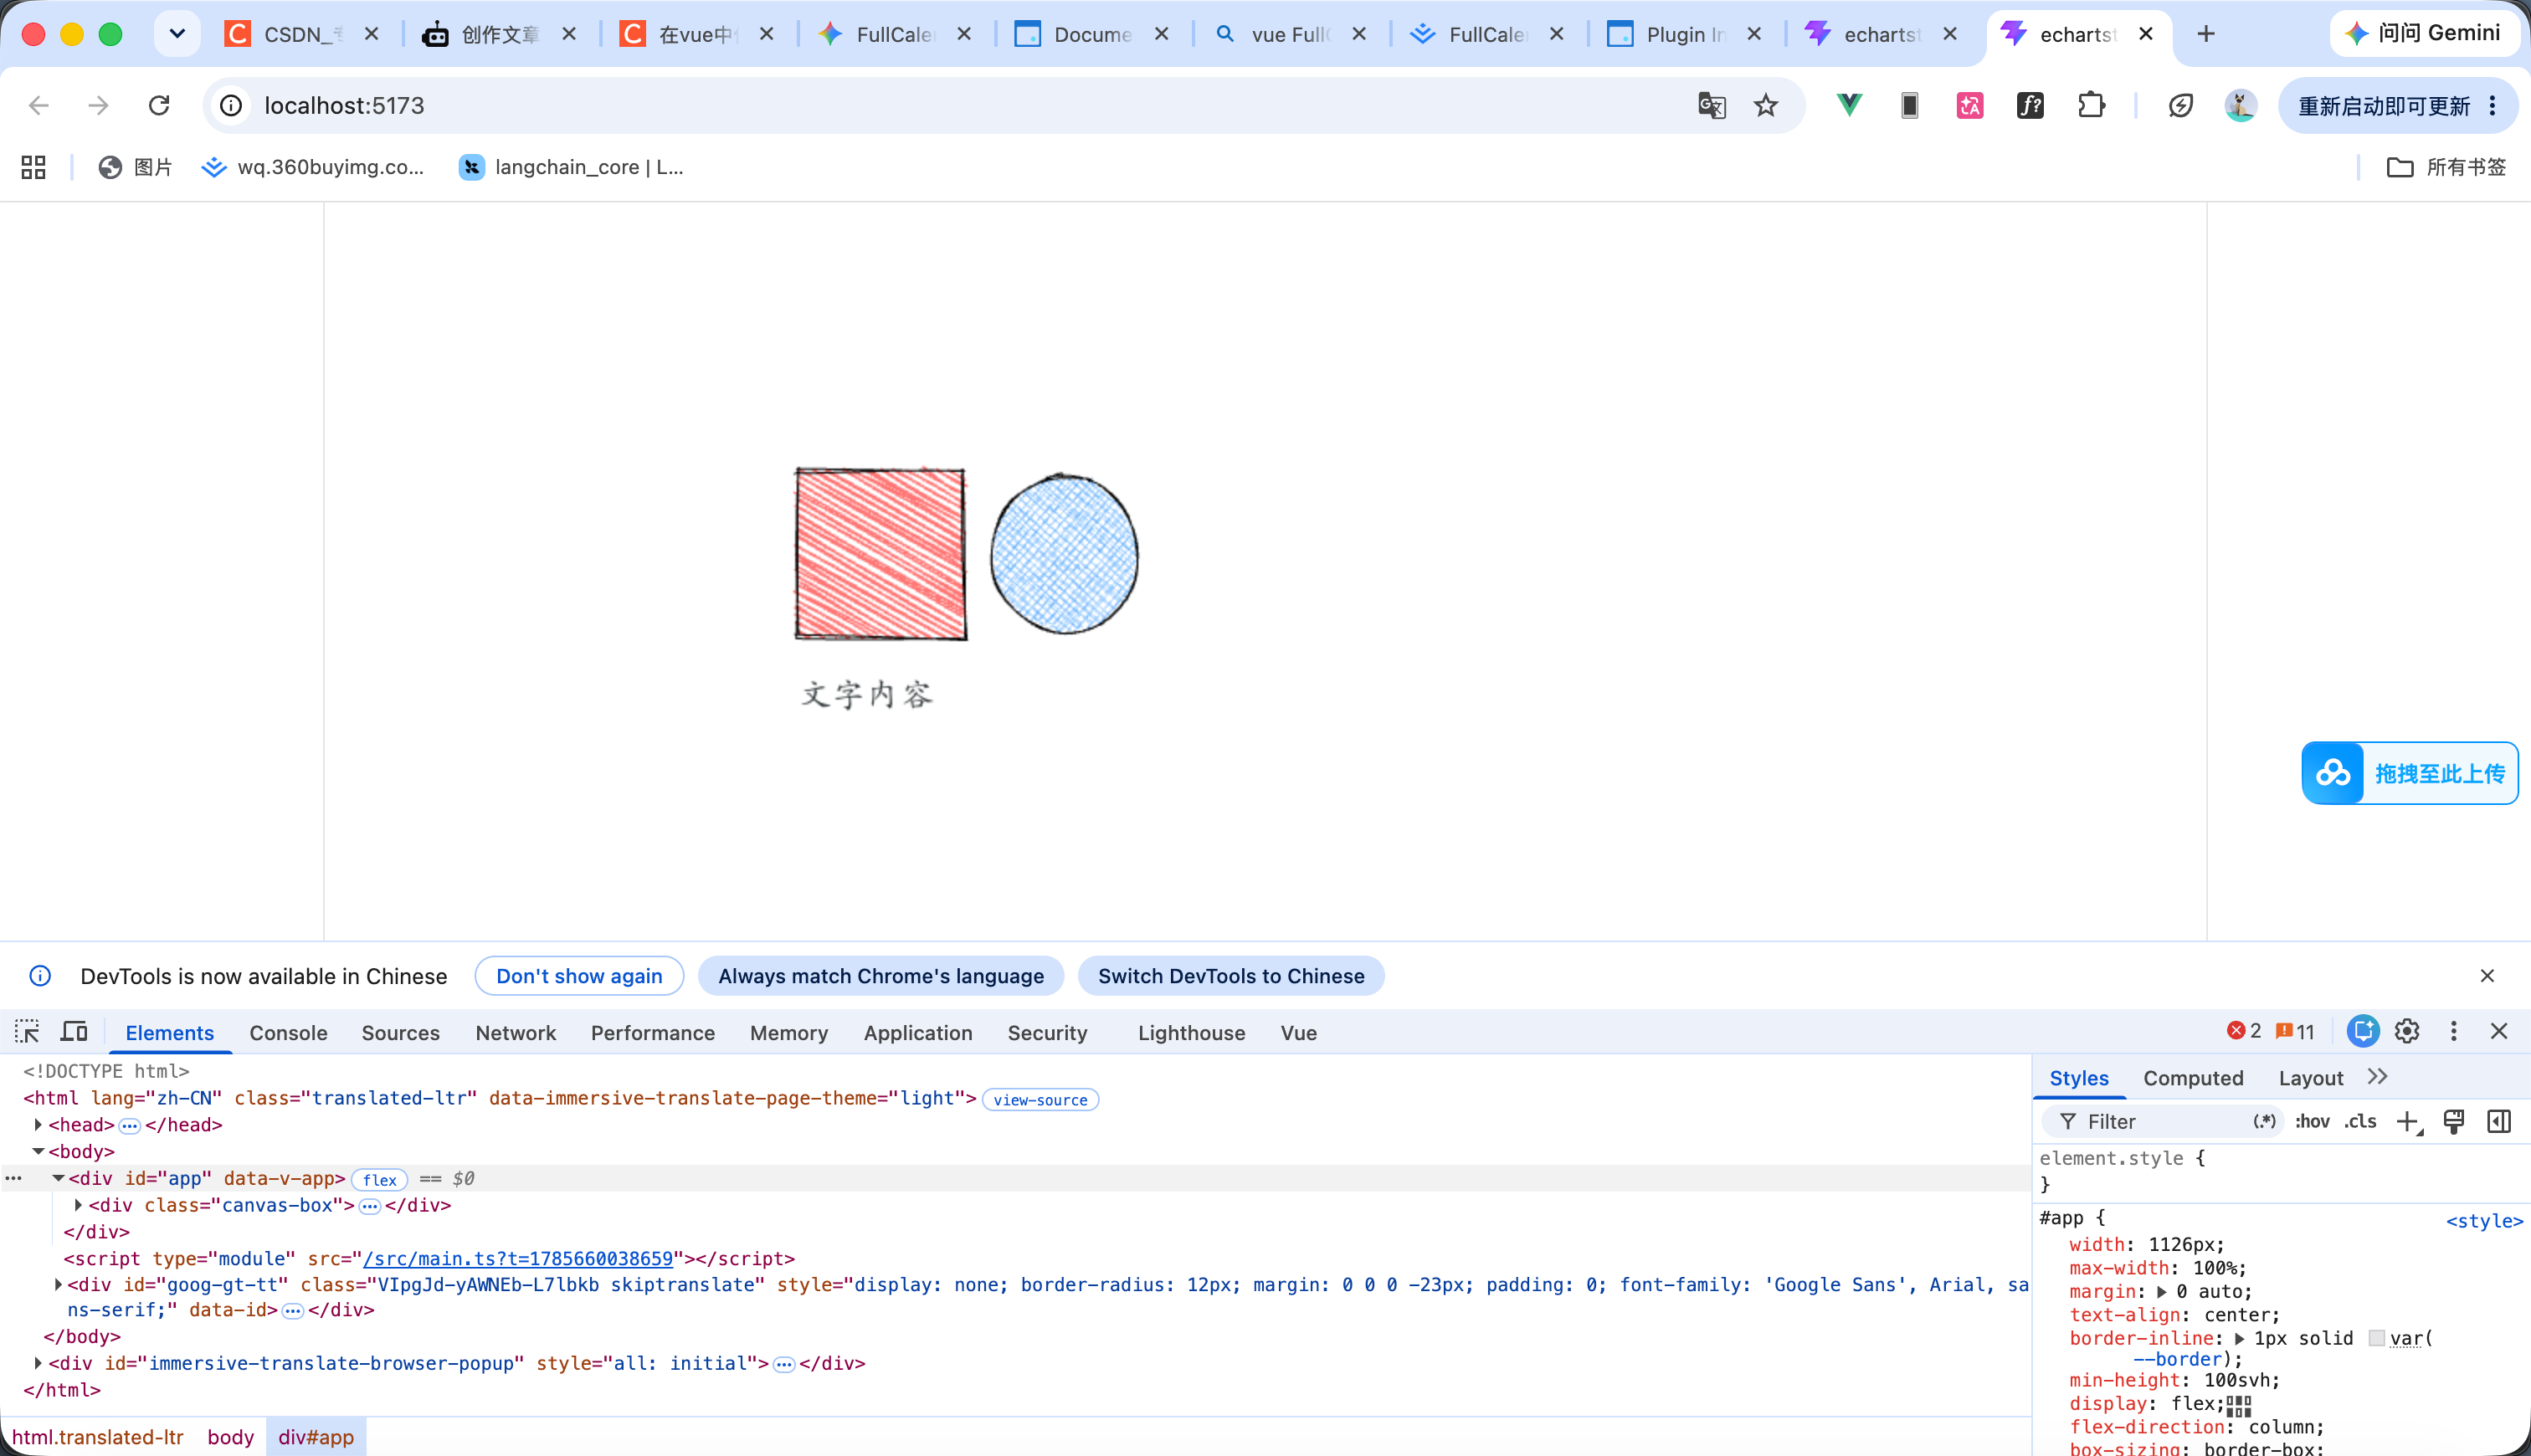
这个代码的核心逻辑就通过 rectangle 等方法,传入不同的 fill(颜色)和 fillStyle(填充样式),来用斜线、交叉网格等不同方式把图形内部涂满。
代码如下 效果如图
<script setup lang="ts">
import { ref, onMounted } from 'vue'
import rough from 'roughjs'
// 绑定 HTML Canvas 节点
const canvasRef = ref<HTMLCanvasElement | null>(null)
// 在 onMounted 中增加绘制逻辑
onMounted(() => {
if (!canvasRef.value) return
const canvas = canvasRef.value
const rc = rough.canvas(canvas)
const ctx = canvas.getContext('2d')!
// 斜线填充
rc.rectangle(20, 160, 100, 100, {
fill: '#ff7675',
// 平行斜线
fillStyle: 'hachure',
// 填充笔触粗细
fillWeight: 1.5,
// 斜线角度
hachureAngle: 60
})
// 交叉网格线填充
rc.circle(180, 210, 90, {
fill: '#74b9ff',
// 网格交错
fillStyle: 'cross-hatch'
})
// 文字
ctx.font = '20px "Comic Sans MS", cursive, sans-serif'
ctx.fillStyle = '#2d3436'
ctx.fillText('文字内容', 20, 300)
})
</script>
<template>
<div class="canvas-box">
<canvas ref="canvasRef" width="600" height="400"></canvas>
</div>
</template>
5
手绘风柱状图
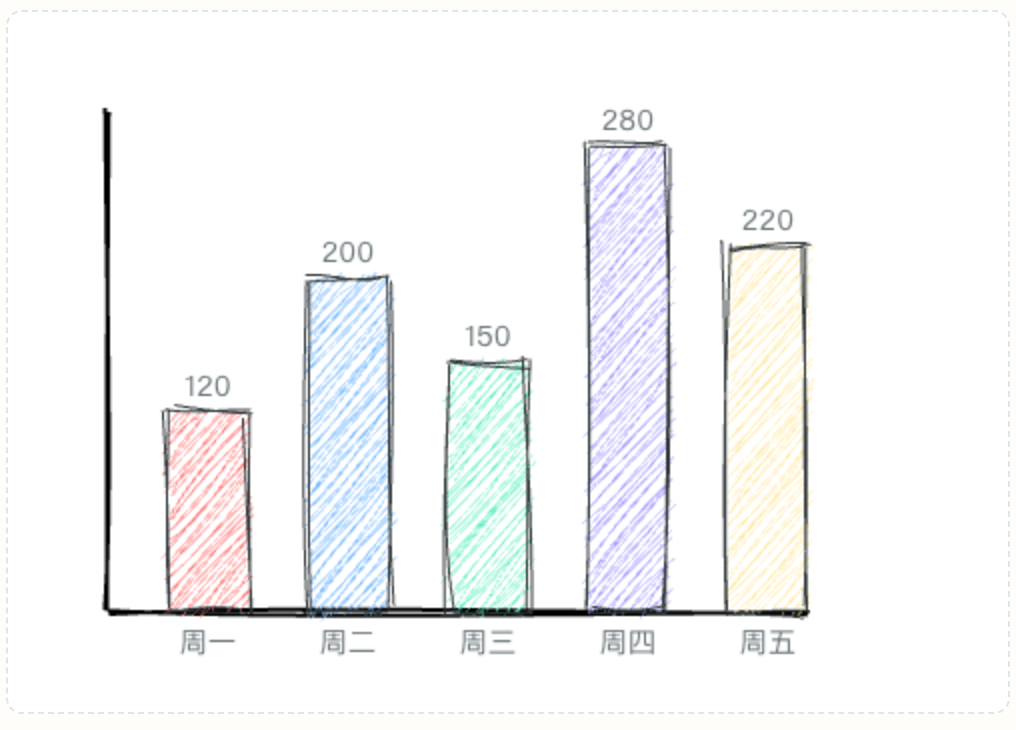
这个代码大概意思就是 先按数据比例计算出柱子的位置与高度。接着用手绘线勾勒出歪歪扭扭的矩形外框,再用彩色斜线在框内进行填充,最后在矩形上下两侧分别绘制出对应的日期标签和具体数值。
代码如下
<script setup lang="ts">
// 从 vue 库里引入响应式引用 ref 和组件挂载钩子 onMounted
import { ref, onMounted } from 'vue'
// 引入手绘风绘图库 roughjs
import rough from 'roughjs'
// 定义一下柱状图每个数据项长啥样(接口类型约束)
interface ChartData {
// 名字
label: string
// 值
value: number
// 颜色
color: string
}
// 测试数据
const chartData: ChartData[] = [
{ label: '周一', value: 120, color: '#ff7675' },
{ label: '周二', value: 200, color: '#74b9ff' },
{ label: '周三', value: 150, color: '#55efc4' },
{ label: '周四', value: 280, color: '#a29bfe' },
{ label: '周五', value: 220, color: '#ffeaa7' }
]
// 绑定画布元素
const chartCanvasRef = ref<HTMLCanvasElement | null>(null)
/**
* 绘画方法
*/
const drawHandDrawnChart = () => {
// 拿到页面上的 canvas 节点对象
const canvas = chartCanvasRef.value
if (!canvas) return
// 初始化 Rough 画布
const rc = rough.canvas(canvas)
// 拿到原生的 Canvas 2D 绘图上下文
const ctx = canvas.getContext('2d')!
// 每次重新画之前,把整个画布擦干净(从左上角 0,0 擦到右下角宽高)
ctx.clearRect(0, 0, canvas.width, canvas.height)
// 设置画图的四周留白边距为 50 像素
const padding = 50
// 计算除去上下留白后,柱状图真正的可绘图高度
const chartHeight = canvas.height - padding * 2
// X 轴起点横坐标
const startX = padding
// Y 轴起点纵坐标
const startY = canvas.height - padding
// 设定每根柱子的宽度
const barWidth = 40
// 设定柱子与柱子之间的间距
const gap = 30
// 用手绘线条画 X 轴(从左到右)
rc.line(startX, startY,
startX + chartData.length * (barWidth + gap),
startY, { strokeWidth: 2, roughness: 1.2 })
// 用手绘线条画 Y 轴(从下到上)
rc.line(startX, startY, startX, padding, { strokeWidth: 2, roughness: 1.2 })
// 遍历上面准备好的每一个数据项,挨个把柱子和文字画出来
chartData.forEach((item, index) => {
// 算一下当前这根柱子左上角的横坐标
const x = startX + gap + index * (barWidth + gap)
// 柱子的实际像素高度
const barH = (item.value / 300) * chartHeight
// 算一下柱子左上角的纵坐标
const y = startY - barH
// 画柱子
rc.rectangle(x, y, barWidth, barH, {
// 填充颜色
fill: item.color,
// 填充风格
fillStyle: 'hachure',
// 粗糙度
roughness: 1.8,
// 矩形边框颜色
stroke: '#2d3436'
})
// 字体大小和字体样式
ctx.font = '14px sans-serif'
// 设定文字的颜色
ctx.fillStyle = '#636e72'
// 居中对齐
ctx.textAlign = 'center'
// 把文字 画在 X 轴下方(柱子中间靠下 20 像素的位置)
ctx.fillText(item.label, x + barWidth / 2, startY + 20)
ctx.fillText(String(item.value), x + barWidth / 2, y - 8)
})
}
// 当组件被渲染挂载到页面上之后,立即执行画图函数
onMounted(() => {
drawHandDrawnChart()
})
</script>
<template>
<div class="chart-wrapper">
<h3>极简手绘柱状图</h3>
<canvas ref="chartCanvasRef" width="500" height="350"></canvas>
</div>
</template>
<style scoped>
.chart-wrapper {
max-width: 550px;
margin: 30px auto;
padding: 20px;
background: #fffdf9; /* 仿发黄画纸底色 */
border-radius: 12px;
box-shadow: 0 4px 16px rgba(0, 0, 0, 0.08);
text-align: center;
}
h3 {
color: #2d3436;
margin-bottom: 15px;
}
canvas {
background: #ffffff;
border: 1px dashed #dfe6e9;
border-radius: 8px;
}
</style>
 0
0 0
0 0
0 qq空间
qq空间  微博
微博  复制链接
复制链接  分享
分享  本文未经作者允许授权,禁止转载
 更多相关项目
猜你喜欢
评论/提问(已发布 0 条)

 评论
评论  收藏
收藏  分享
分享  下载
下载  举报
举报  回顶部
回顶部