Vue 3 集成 Apache ECharts 图表 使用指南

 0
0 0
0 0
0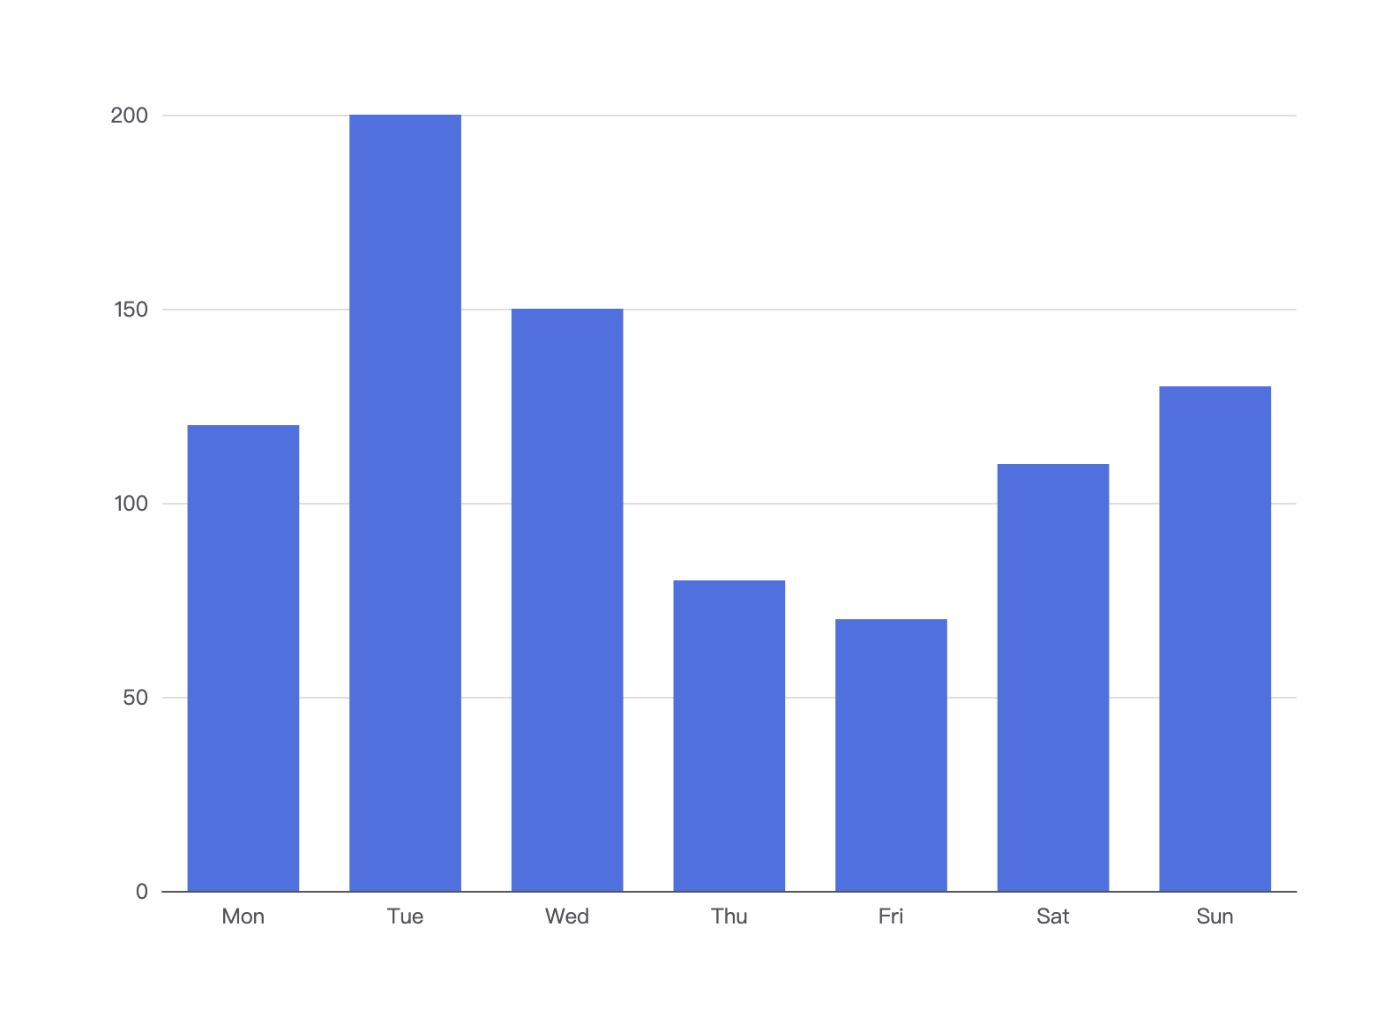
ECharts 是一个基于 JavaScript 的开源可视化图表库,提供柱状图、折线图、饼图、散点图等多种图表类型,能够帮助开发者更加直观地展示数据。本文将介绍如何在 Vue 3 项目中使用 ECharts,包括基础图表的创建、按需引入模块以及通过 ResizeObserver 实现图表的响应式适配。
1
前言
ECharts 是一个基于 JavaScript 的开源可视化图表库,提供柱状图、折线图、饼图、散点图等多种图表类型,能够帮助开发者更加直观地展示数据。
官网链接 https://echarts.apache.org/handbook/en/get-started/
2
安装 ECharts
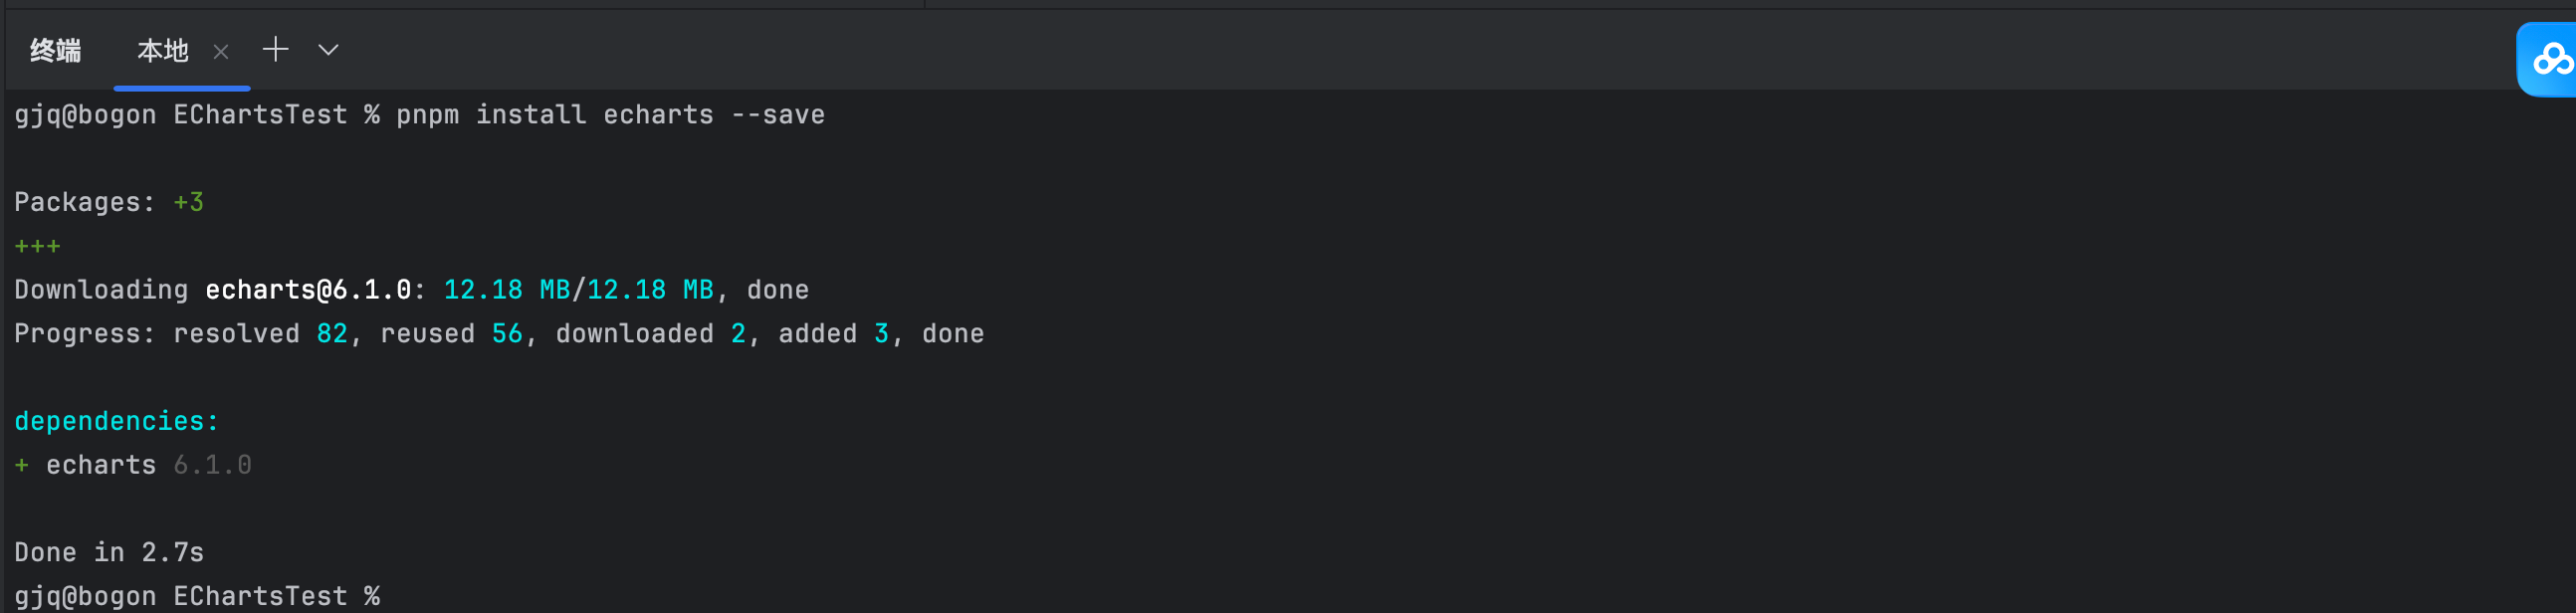
如图所示 输入命令
pnpm install echarts --save
3
基础使用
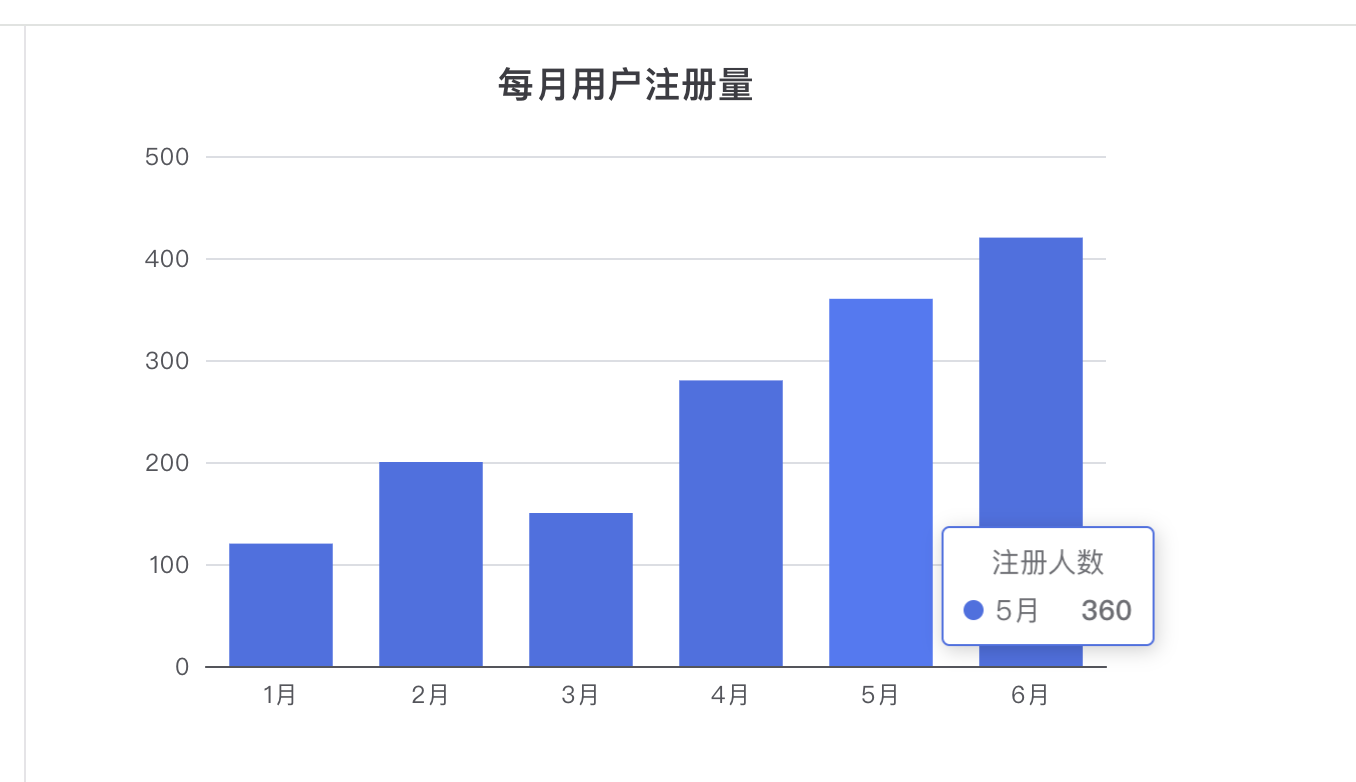
这段代码 就是 onMounted 生命周期中初始化 ECharts 实例并使用 setOption 配置柱状图。组件卸载时调用 dispose() 销毁图表实例,避免资源泄漏。
<template>
<div ref="chartDom" style="width: 600px; height: 400px"></div>
</template>
<script setup>
import { ref, onMounted, onUnmounted } from 'vue'
import * as echarts from 'echarts'
const chartDom = ref(null)
let myChart = null
// 初始化图表
const initChart = () => {
myChart = echarts.init(chartDom.value)
// 配置项对象
const option = {
title: {
text: '每月用户注册量'
},
tooltip: {},
xAxis: {
data: ['1月', '2月', '3月', '4月', '5月', '6月']
},
yAxis: {},
series: [
{
name: '注册人数',
type: 'bar',
data: [120, 200, 150, 280, 360, 420]
}
]
}
// 使用配置
myChart.setOption(option)
}
// 生命周期钩子
onMounted(() => {
// 挂载后才能操作 DOM
initChart()
})
onUnmounted(() => {
if (myChart) {
myChart.dispose() // 销毁实例
}
})
</script>
4
按需引入


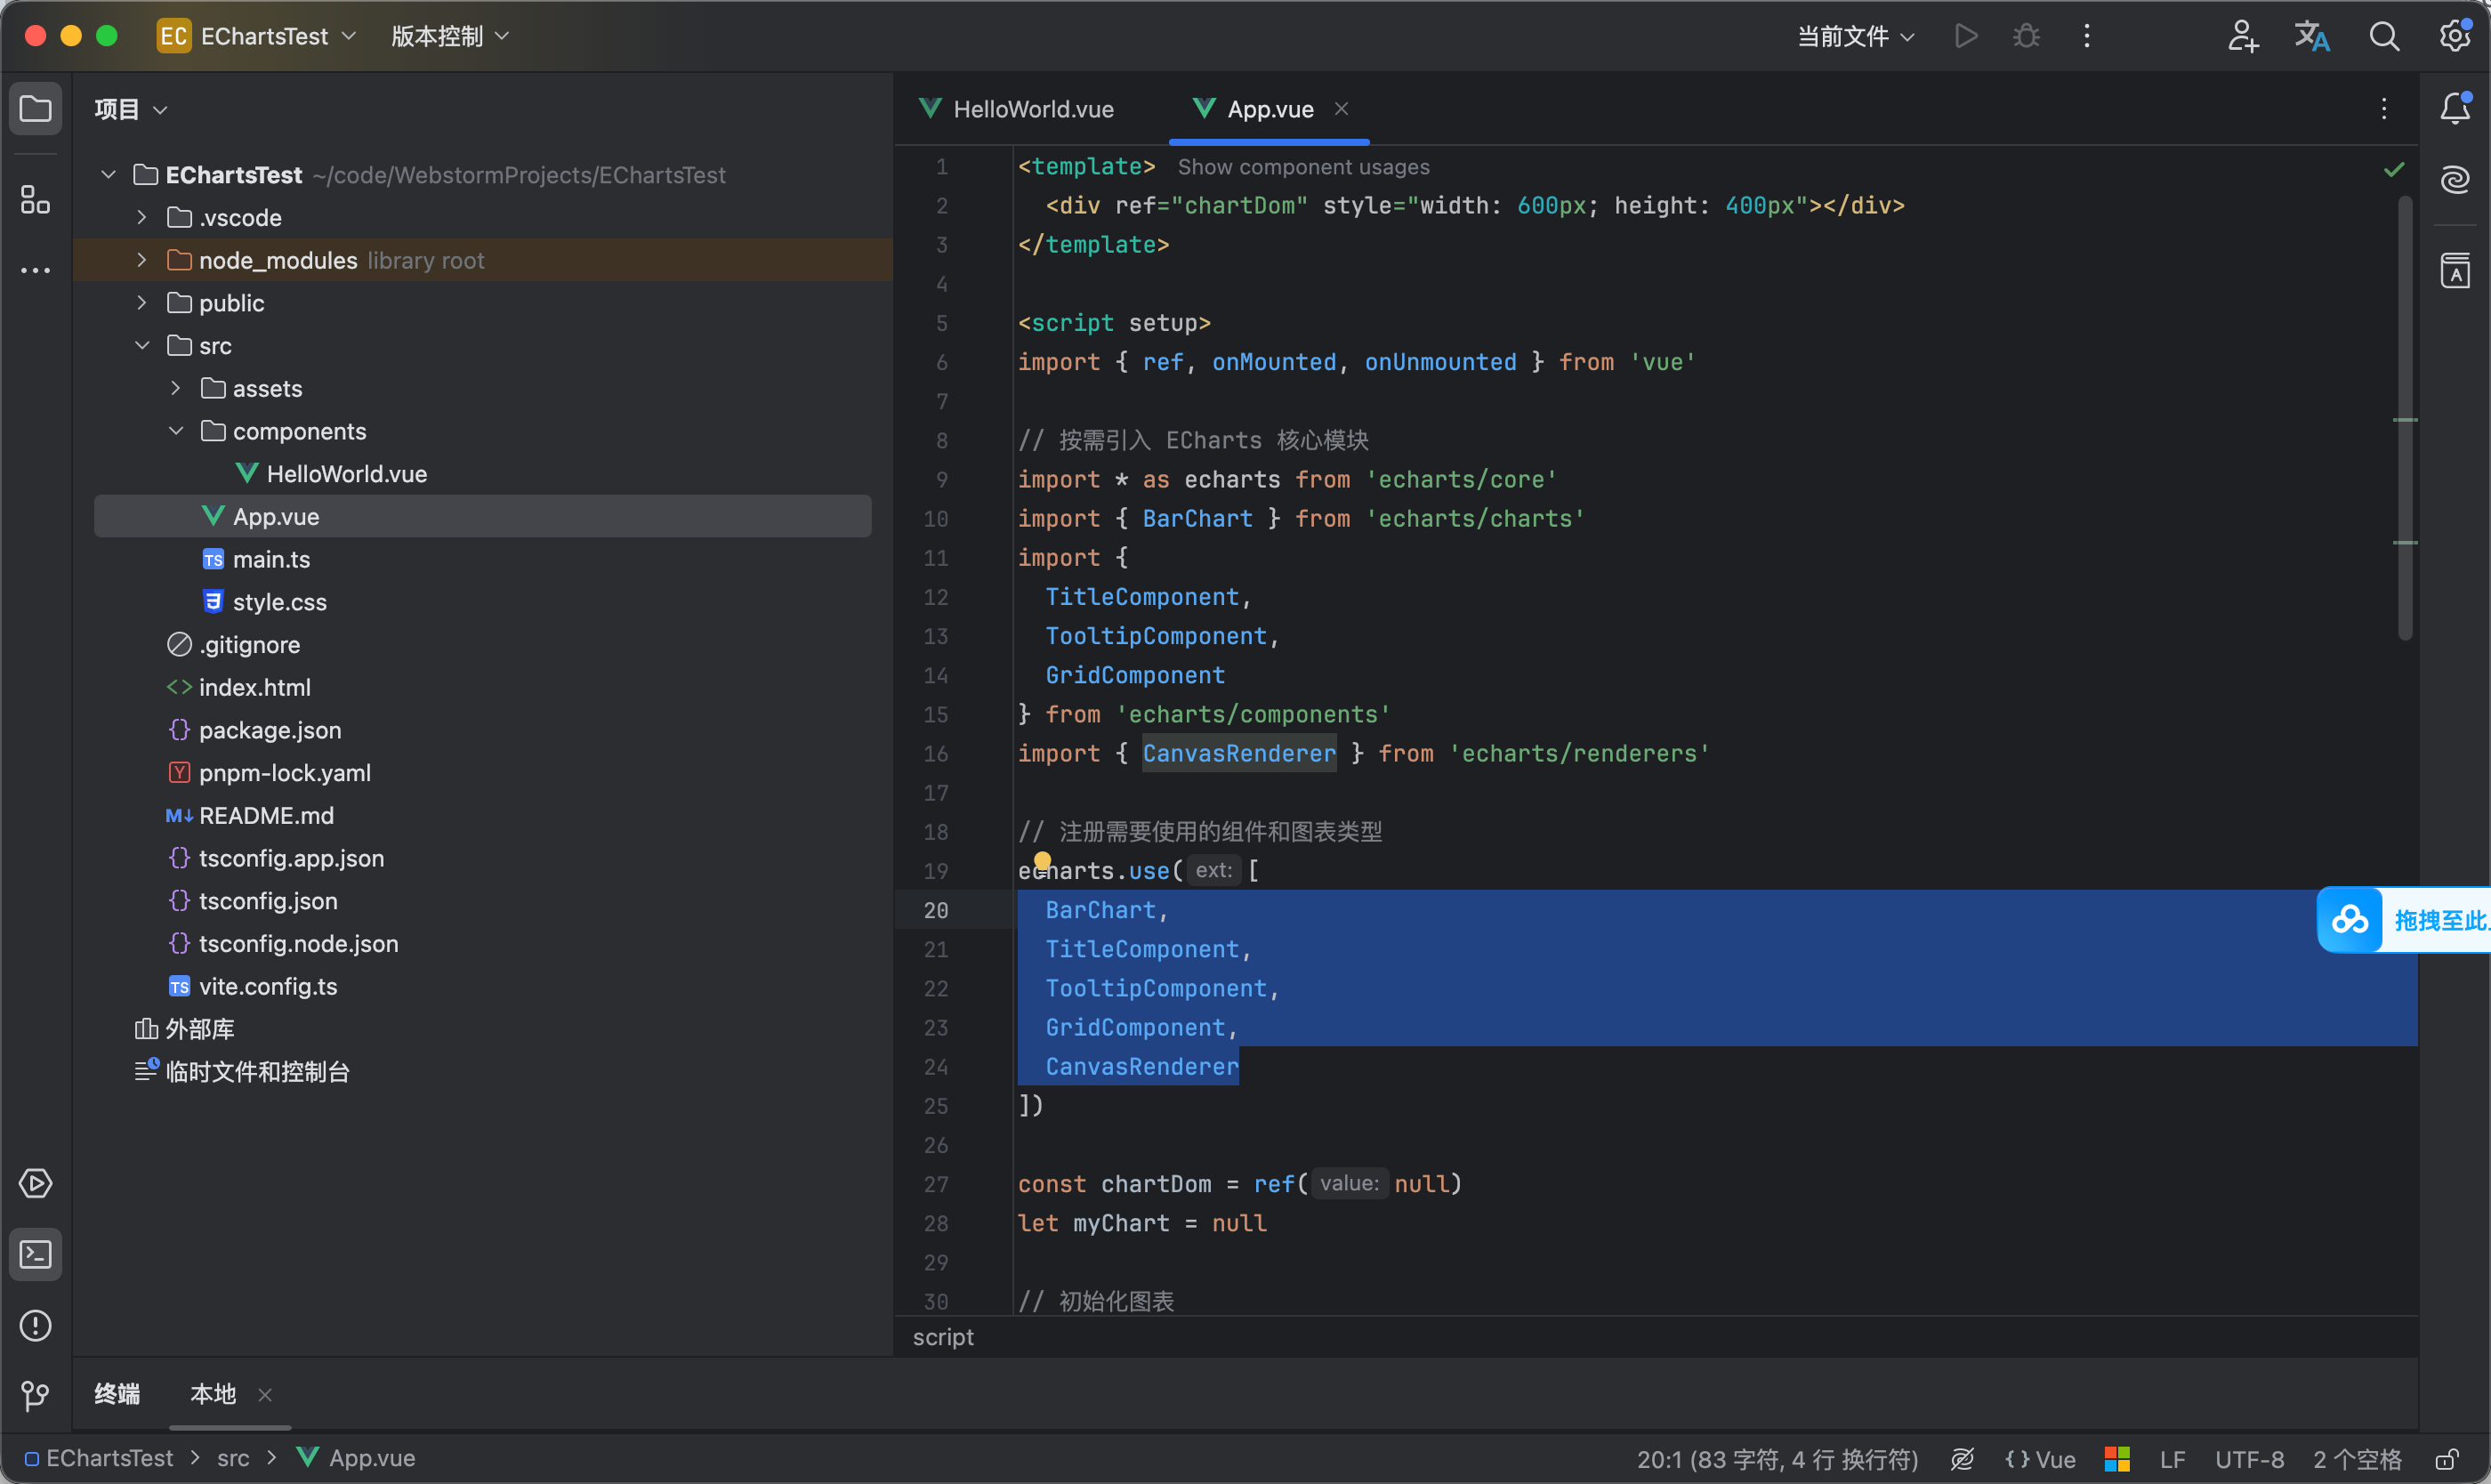
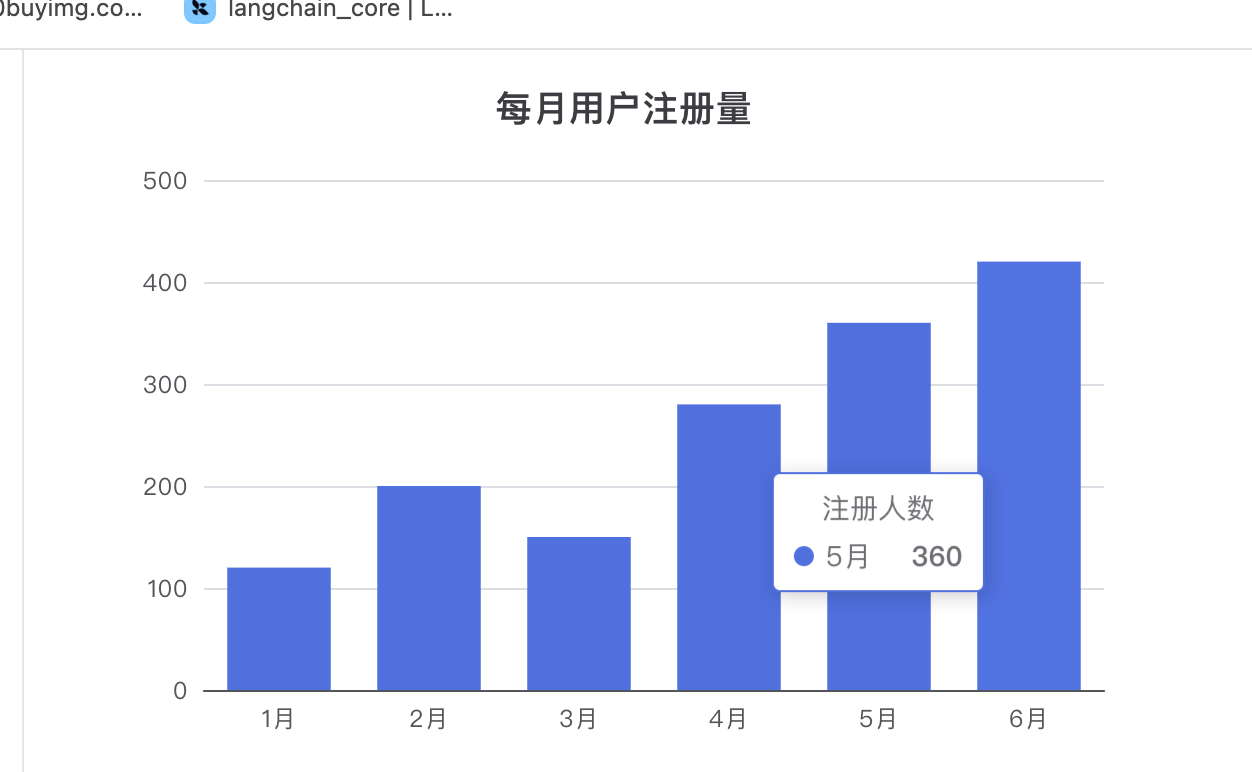
12
为了减小打包体积,可以按需引入 ECharts 的模块 只引入需要的模块
如下代码 BarChart, 代表 柱状图 TitleComponent 是 标题组件 TooltipComponent 是我们悬浮展示的提示框组件 GridComponent 网格坐标系布局组件 CanvasRenderer是最基础的 Canvas 渲染器 必须引入的
<template>
<div ref="chartDom" style="width: 600px; height: 400px"></div>
</template>
<script setup>
import { ref, onMounted, onUnmounted } from 'vue'
// 按需引入 ECharts 核心模块
import * as echarts from 'echarts/core'
import { BarChart } from 'echarts/charts'
import {
TitleComponent,
TooltipComponent,
GridComponent
} from 'echarts/components'
import { CanvasRenderer } from 'echarts/renderers'
// 注册需要使用的组件和图表类型
echarts.use([
BarChart,
TitleComponent,
TooltipComponent,
GridComponent,
CanvasRenderer
])
const chartDom = ref(null)
let myChart = null
// 初始化图表
const initChart = () => {
myChart = echarts.init(chartDom.value)
// 配置项对象
const option = {
title: {
text: '每月用户注册量'
},
tooltip: {},
xAxis: {
data: ['1月', '2月', '3月', '4月', '5月', '6月']
},
yAxis: {},
series: [
{
name: '注册人数',
type: 'bar',
data: [120, 200, 150, 280, 360, 420]
}
]
}
// 使用配置
myChart.setOption(option)
}
// 生命周期钩子
onMounted(() => {
// 挂载后才能操作 DOM
initChart()
})
onUnmounted(() => {
if (myChart) {
myChart.dispose()
}
})
</script>
5
响应式图表
使用 ResizeObserver 实现更精确的响应式 监听图表容器尺寸变化 相当于 只要容器变大或变小,就通知 ECharts 重新调整图表大小。 效果看视频
<template>
<div ref="chartDom" style="width: 100%; height: 400px"></div>
</template>
<script setup>
import { ref, onMounted, onUnmounted } from 'vue'
import * as echarts from 'echarts'
const chartDom = ref(null)
let myChart = null
let resizeObserver = null
// 初始化图表
const initChart = () => {
myChart = echarts.init(chartDom.value)
// 配置项对象
const option = {
title: {
text: '每月用户注册量'
},
tooltip: {},
xAxis: {
data: ['1月', '2月', '3月', '4月', '5月', '6月']
},
yAxis: {},
series: [
{
name: '注册人数',
type: 'bar',
data: [120, 200, 150, 280, 360, 420]
}
]
}
// 使用配置
myChart.setOption(option)
}
// 监听图表容器尺寸变化
const setupResizeObserver = () => {
resizeObserver = new ResizeObserver(() => {
myChart?.resize()
})
resizeObserver.observe(chartDom.value)
}
// 生命周期钩子
onMounted(() => {
// 挂载后才能操作 DOM
initChart()
setupResizeObserver()
})
onUnmounted(() => {
// 停止监听容器尺寸变化
resizeObserver?.disconnect()
// 销毁图表实例
myChart?.dispose()
})
</script>
 0
0 0
0 0
0 qq空间
qq空间  微博
微博  复制链接
复制链接  分享
分享  本文未经作者允许授权,禁止转载
 更多相关项目
猜你喜欢
评论/提问(已发布 0 条)

 评论
评论  收藏
收藏  分享
分享  下载
下载  举报
举报  回顶部
回顶部